Repeating Tables and Sections in PowerApps
Ever since Microsoft announced that InfoPath would be going the way of the dinosaur, developers have been looking for alternatives to the program. With the introduction of PowerApps, users have found most of what they loved about InfoPath, plus some improvements. One of the most-used features in InfoPath was the ability to repeat tables, and happily, you can still do that in PowerApps.
What is a repeating table?
A repeating table, or sub-table, is a way to display data from two or more lists. Developers used them to display a many-to-one relationship, such as using a look-up column in a SharePoint list. The idea being you could select an item in a list A and use it to filter items in list B.
In PowerApps, by default, you’ll only be able to see data from the list the app is associated with when you create a new PowerApp. A Gallery is PowerApps’ word for connections to external sources, whether it be SQL, SharePoint, Twitter, etc. Like everything else in PowerApps, the screen is completely customizable via drag-and-drop or Excel-like formulas.
Real-World Example
In this scenario, we’ll be using two lists: one for projects and one for expenses. Our project list is a master list of all large projects occurring in the business, and our expenses list is where we add each expense and income. To make life easier and to view the health of the business, we’ve opted to track all our expenses in a master list, and tag each expense with the project it belongs to. Using our PowerApps, we’ll be able to filter on each project and sub-project.
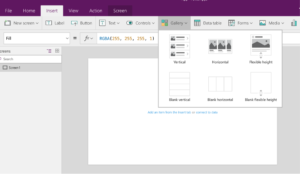
Once you’ve got your blank PowerApp, you can add a new Gallery to it. For the purposes of this example, we’ve used a Blank Screen, then added a Blank Vertical template to it.
From here, we can set our data value. For this exercise, we’re going to use our master project list first.
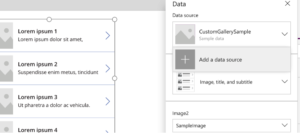
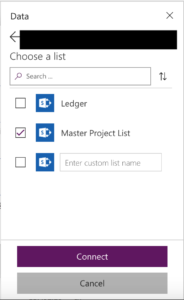
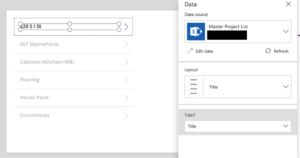
Once we have our project in place, we can select the type of data we want to view. For the purposes of this exercise, we’ve chosen to view simply the title of the items.
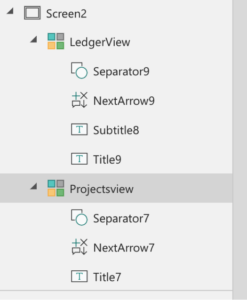
Next, we want to repeat the same action to add a second gallery, this one will show our ledger and items that we want to filter.
This is a good point to rename both Galleries from the standard Gallery1 and Gallery2 to something more meaningful. For the purposes of this exercise, we’ll rename them to ProjectsView and LedgerView.
From here, we want to set the PowerApp to filter on a specific item when it’s selected. On our SharePoint list, the column called Subproject is a lookup column on the Ledger list that displays the Title column in the Project list. In layman’s terms, we’re managing our projects in the projects list, and using it as a drop-down menu.
But because of the way SharePoint reads look-up columns, we won’t be able to use the value. Instead, we’ll have to pull the ID from the project list and add the .ID modifier. Let’s look at it in practice:
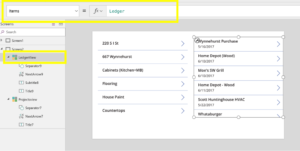
First, select the Ledger View gallery to bring up the Item function in the top header:
We’ll want to use the following syntax:
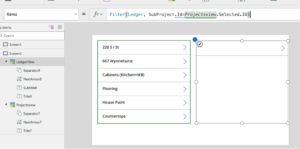
Filter([List name to be filtered],[Column Name].Id=[Gallery Name].Selected.ID)
Where,
- [List to be filtered] = This is the actual list of items to be filtered (in our case, Ledger), NOT the Gallery
- [Column name] = The column we’re applying the filter on (in our case, Subprojects)
- [Gallery name] = The gallery where the selected filter will come from, so in this case, Projects View (note: not the gallery the filter is on)
So for our example, it would be
Filter(‘Ledger’, Subprojects.ID=ProjectsView.Selected.ID)
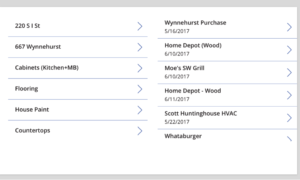
Once we paste that formula into the Items field, the data on the LedgerView gallery disappears, as we haven’t selected anything to sort on.
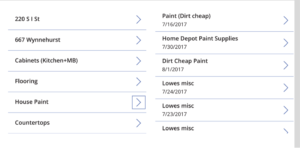
But in practice, selecting the House Paint category brings up all items marked with that project on the list.
Using PowerApp’s customizer, you can change the size of the font, add additional icons, and even add headers and footers.